

Activites
Data
Part 1. At station RV001, near Rovinj harbor, there is a buoy measuring parameters in the atmosphere (air temperature, air pressure, humidity, wind direction and intensity, precipitation) and at the sea surface (sea temperature, salinity, oxygen content, chlorophyll a concentrations and light characteristics; Figure 1). Frequency of measurements is very high and values are presented daily on buoy web site. Measurements started on 14 July 2017.
Part 2. Sampling at standard depts and/or in the entire water column using the CTD probe was performed at number of standard stations (Figure 1). Sampling included temperature, salinity, oxygen saturation, nutrients and chlorophyll-a concentration, pH, phytoplankton and zooplankton distribution and abundance, dissolved organic carbon (DOC), particulate organic carbon (POC) and bacterial abundance. Measurements were performed at RV001 (standard depths and CTD) and ZI332 (CTD); 4. 10., 25. 10., 28.11., 18.12., 25. 1., 5.3.; at SJ108, SJ101, SJ103, SJ105, SJ107, ZI032 and RV001 (standard depths and CTD) and at SJ1A1, SJ1B1, SJ1A8, SJ1B8, SJ102, SJ104, SJ106, ZI031 and ZI332 (CTD); 28. 03. i 30. 08.
Part 3. Use of undulating towed vehicle (Figure 2) on 09. 04. enabled high spatial resolution profile of temperature, salinity and density to be obtained. During the same cruise other physical, chemical and biological parameter were sampled on stations EC001, EC002 and EC003 (standard depths and CTD) and EC004 (CTD).
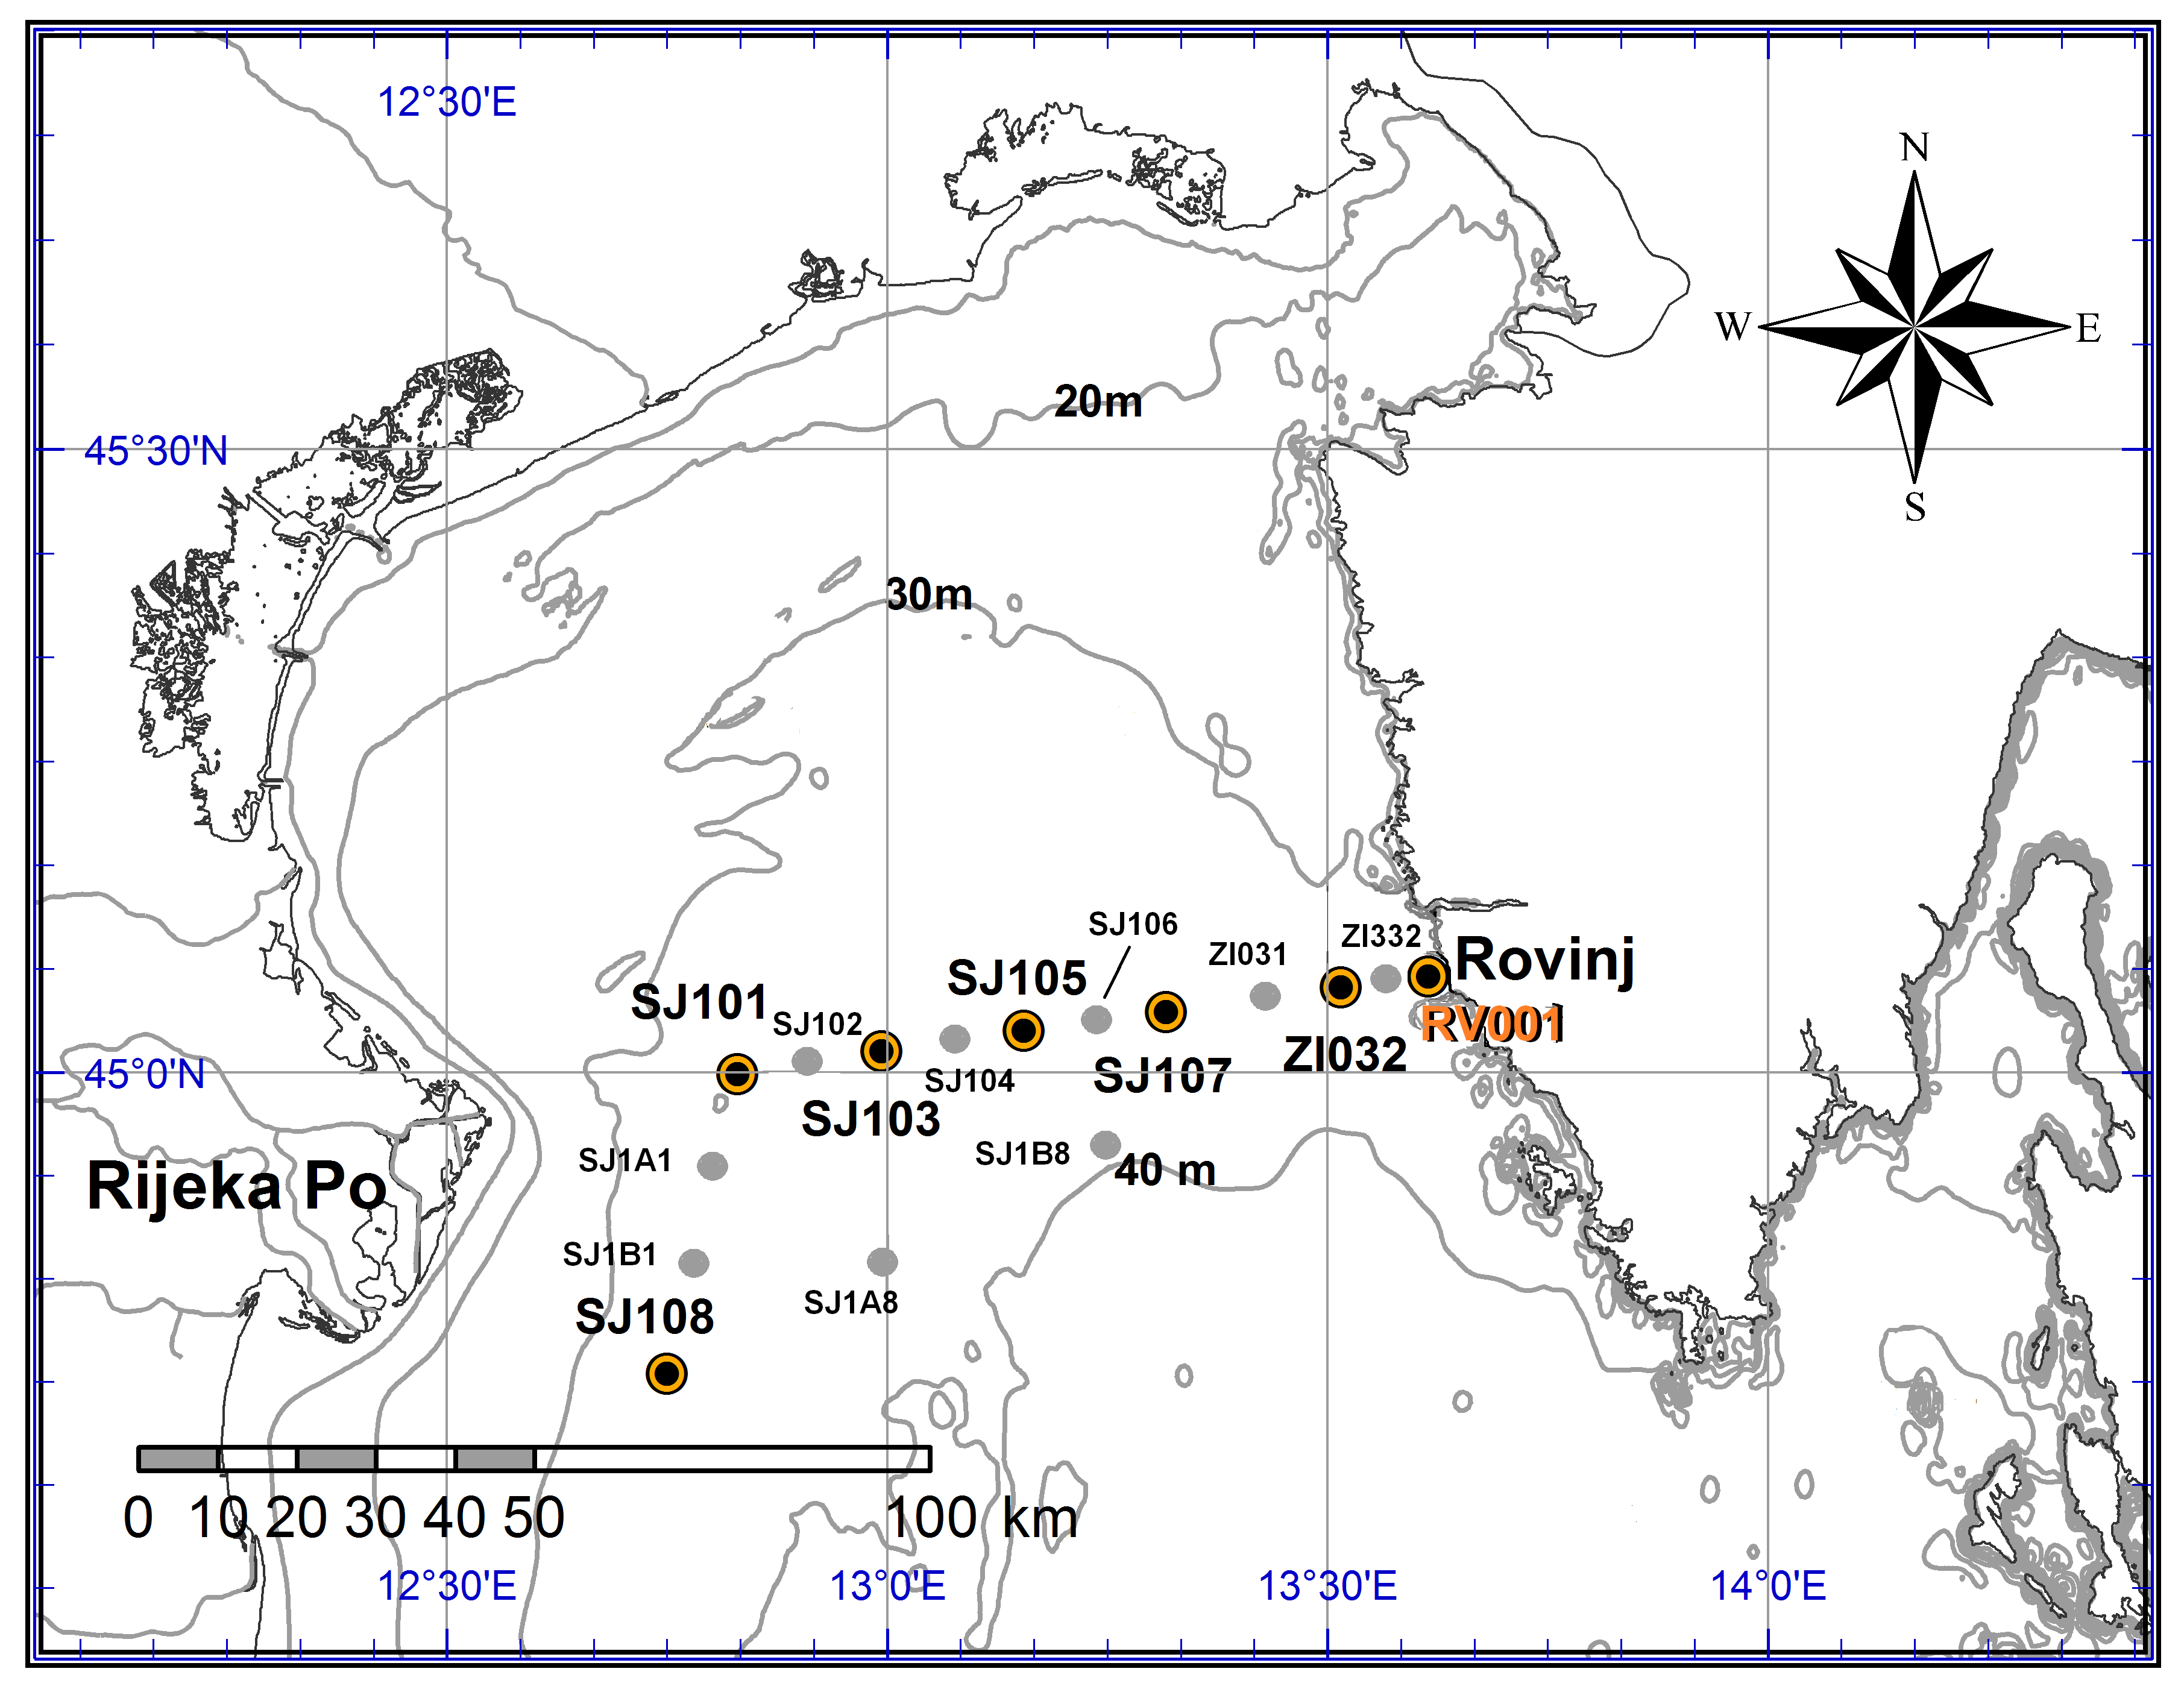
Slika 1. Položaj i nazivi standardnih postaja u sjevernom Jadranu.
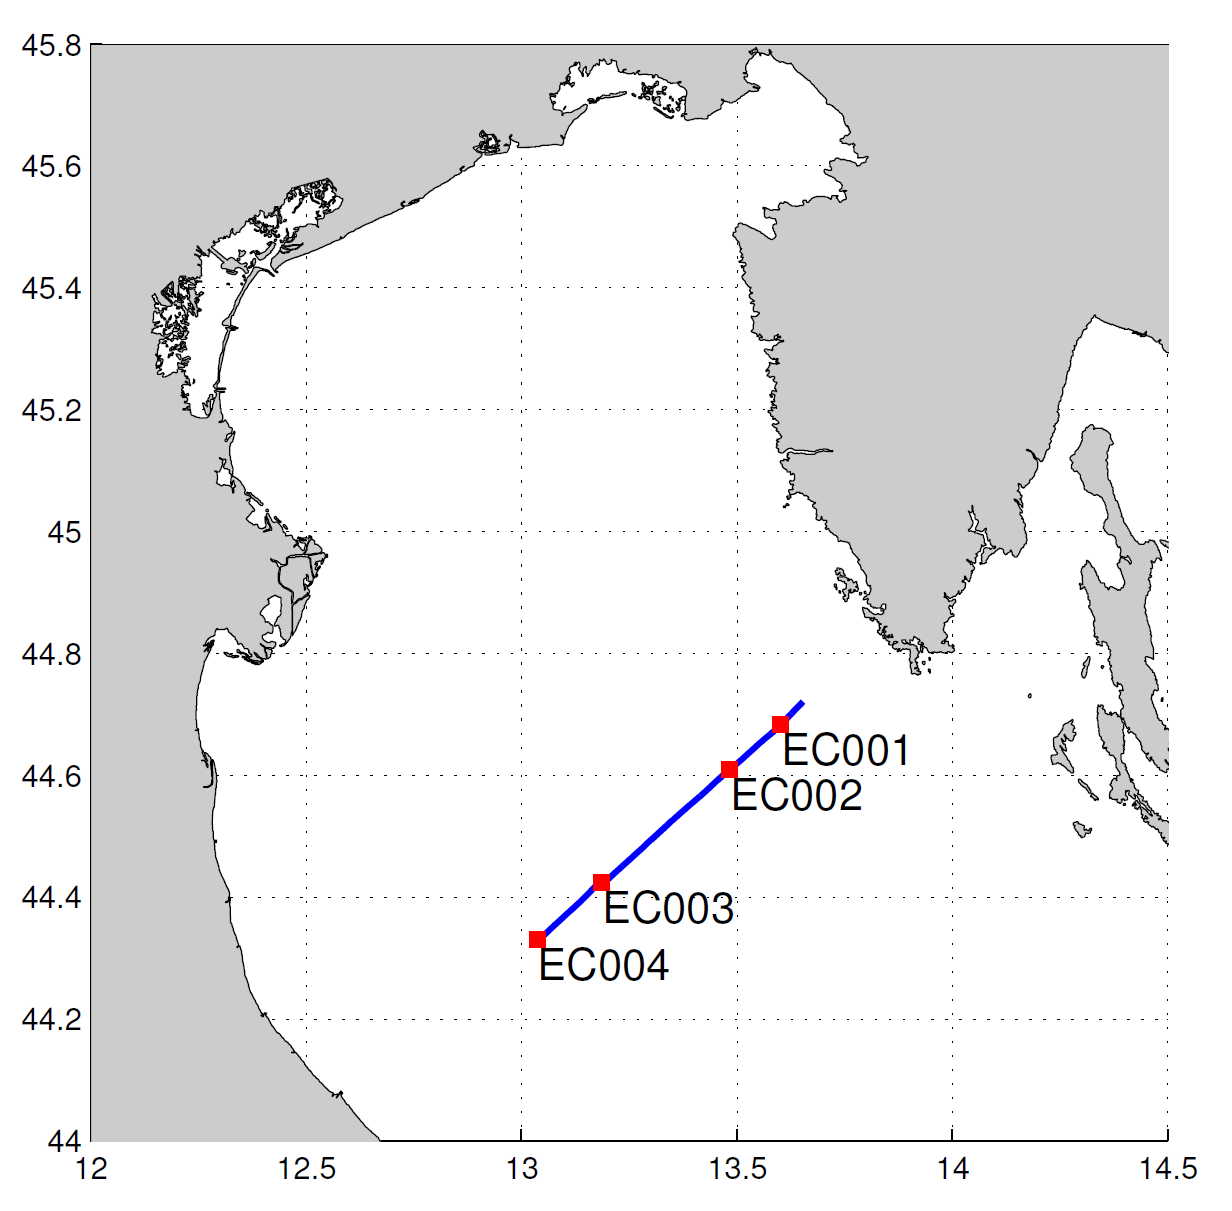
Slika 2. Plavom crtom je označena staza undulatora, a crvenim kvadraticima postaje na stazi.
Buoy
The oceanographyc buoy (1 m hight, 3 m in diameter, 1300 kg, solar power supply) is equipped with set of meteorological and oceanographic sensors sampling continousely with 8 Hz (Figures 3 and 4).

Slika 3. Plutača sa sastavnim dijelovima (engleski nazivi).

Slika 4. Oceanografski senzori na dnu tijela plutače (slika je samo primjer; plutača ispred Rovinja na dnu tijela ima drugačije senzore).
Data collected at standard depths
Water samples were collected using 5 L Niskin bottles at standard oceanographic depths (0 m, 5 m, 10 m, 20 m, 30 m and around 35 m at deeper stations SJ105 and SJ107). Temperatures were measured with protected reversing thermometers (Richter&Wiese; precision ± 0.01 °C) attached to the Niskin bottles. Salinity samples were analysed in the land laboratory by high precision salinometers (Beckman RS-7C and Yeo-Kal 601; precision ± 0.01), using algorithms recommended by UNESCO (1983).Nutrient concentrations (total inorganic nitrogen - TIN as the sum of nitrate-NO3, nitrite-NO2 and ammonium-NH4, orthophosphate-PO4 and orthosilicate-SiO4) were analysed aboard immediately after sample collection by spectrophotometric methods widely used in oceanography (Parsons et al., 1984).
Ammonium was determined by a modified technique of the indophenol blue method (Ivančić and Degobbis, 1984). Chlorophyll a concentrations were measured fluorometrically after extraction of GF/F filters with acetone (Parsons et al., 1984). Oxygen content was measured onboard following the Winkler method (Strickland & Parsons 1972). The pH is determined electrochemically using an pH-meter after calibration of the electrode with pH buffers. Dissolved (DOC) and particulate (POC) organic carbon are measured by high temperature catalytic oxidation (HTCO) method and non-dispersive infrared (NDIR) CO2 detection using a TOC-Vcph instrument (Shimadzu, Japan). To determine the dissolved fraction (DOC), platinum on silica is used as a catalyst. To determine the particulate fraction (POC), the combination of Pt/Si and CoO are used as a catalyst and the analysis is performed in the solid sample module SSM-5000A.
- Ivančić, I., Degobbis, D., 1984. An optimal manual procedure for ammonia analysis in natural waters by the indophenol blue method. Water Research 18, 1143-1147.
- Parsons, T.R., Maita, Y., Lalli, C.M., 1984. A manual of chemical and biological methods for seawater analysis. Pergamon Press, Toronto, 173 pp.
- Strickland J.D., Parsons T.T., 1972. A practical handbook of seawater analysis. Bulletin of the Fishery Research Board of Canada, 167, 310.
- UNESCO, 1983. Algorithms for computation of fundamental properties of seawater. UNESCO Technical Papers in Marine Science, No. 44, 53 pp.
Samples (200 ml) for the identification and enumeration of phytoplankton cells were preserved in neutralized formaldehyde (2% final concentration) solution. Sub-samples of 50 mL were allowed to sediment for 24 h and cells were counted on an inverted Zeiss Axiovert 200 microscope following the Utermöhlmethod (Utermöhl, 1958). Cells were counted on transects or randomly selected fields. Nanophytoplankton cells (2-20 µm) were first analyzed at 400× magnification. In this way small coccolitophorids, small individual diatom cells (for example, the cells of the genus Chaetoceros), small dinoflagelates and the nanoflagellateswere counted. Flagellates (< 20 µm) were not identified at the species level but grouped in the following algal groups: cryptophytes, prymnesiophytes, prasinophytes, and chlorophytes.
The groups that were very numerous were counted in the randomly selected fields at 400 ×magnification. After that microphytoplankton is counted at 200 magnification on 2 transectsusing phase contrast. After that, whole chamber bottom is examinedat 100 magnification in this way big dinoflagellated cells are counted or low abundance cells, which were not counted before.Very abundant cell can be counted withrandomly selected fieldsat × 200 magnification. Accuracy of counting this method is around ± 10%. Counted values are converted to the number of cells per liter of sea water with different conversion factors. The main taxonomic references used to identify the phytoplankton were Tomas (1997), Viličić 2002.
- Tomas, C. R., 1997. Identifying marine phytoplankton. Academic press. San Diego. Viličić D., 2002. Fitoplankton Jadranskoga mora: biologija i taksonomija. Školska knjiga.
Samples for microzooplankton were taken at the surface, 10 and 20 m, and near the bottom using a 5 l Niskin bottle. Plankton samples were preserved in 2.5% final concentration of formaldehyde. In the laboratory, samples were reduced from the original volume of 5 1 to 10 ml for 72 h sedimentation. The organisms were counted in a glass cell (measuring 7 x 4.5 x 0.5 cm) by an inverted Olympus IMT-2 microscope at a magnification of 100 and 400x. Identifications of tintinnids were made on the basis of lorica morphology using standard taxonomic reference (Kršinić, 2010). Mezozooplankton were collected by bottom- to-surface vertical tows with WP2 plankton net (diameter 80 cm) and were examined under an Olympus SZX 9 stereomicroscope.
- Kršinić, F., 2010. Tintinnids (Tintinnida, Choreotrichia, Ciliata) in the Adriatic Sea, Mediterranean. Part I. Taxonomy, Institute of Oceanography and Fisheries, Split, 186 pp.
For the abundance of heterotrophic bacteria (HB), heterotrophic nanoflagellates (HNF) and cyanobacteria (CB) in seawater, an aliquot of 20 ml was fixed with formaldehyde (final concentration of 2%) and stored at 4⁰C until the analysis. Samples for HB count were filtered onto black 0.2 μm Nuclepore polycarbonate membrane, stained with DAPI (Porter and Feig, 1980). At least 500 cells per sample were counted. Samples for CB and HNF counts were filtered onto black 0.4 μm Nuclepore polycarbonate membrane. The CB count was performed using green light excitation, with a minimum of 300 cells counted per sample (Takahashi et al., 1985) while HNF abundance was obtained by DAPI staining technique (Sherr et al., 1993). A Leitz Laborlux D epifluorescent microscope was used for counts at 1000 × magnification.
- Porter, K.G., Feig, Y.S., 1980. The use of DAPI for identifying and counting aquatic microflora. Limnol. Oceanogr. 25, 943–948.
- Sherr, E.B., Caron, D.A and Sherr, B.F., 1993. Staining of heterotrophic protists for visualization via epifluorescence microscopy. Ch. 26 in Handbook of methods in aquatic microbial ecology., 213-229.
- Takahashi, M.K., Kikuchi, K., Hara, Y., 1985. Importance of picocyanobacteria (unicellular blue-green algae) in the phytoplankton population of the coastal waters off Japan Mar. Biol. 89, 63–69.
CTD probe
The data were collected with a SeaBird Electronic SBE. The sampling frequencies were 8 Hz. Data were acquired and processed according to UNESCO (1988) standards, obtaining pressure-averaged data (0.5 db interval).
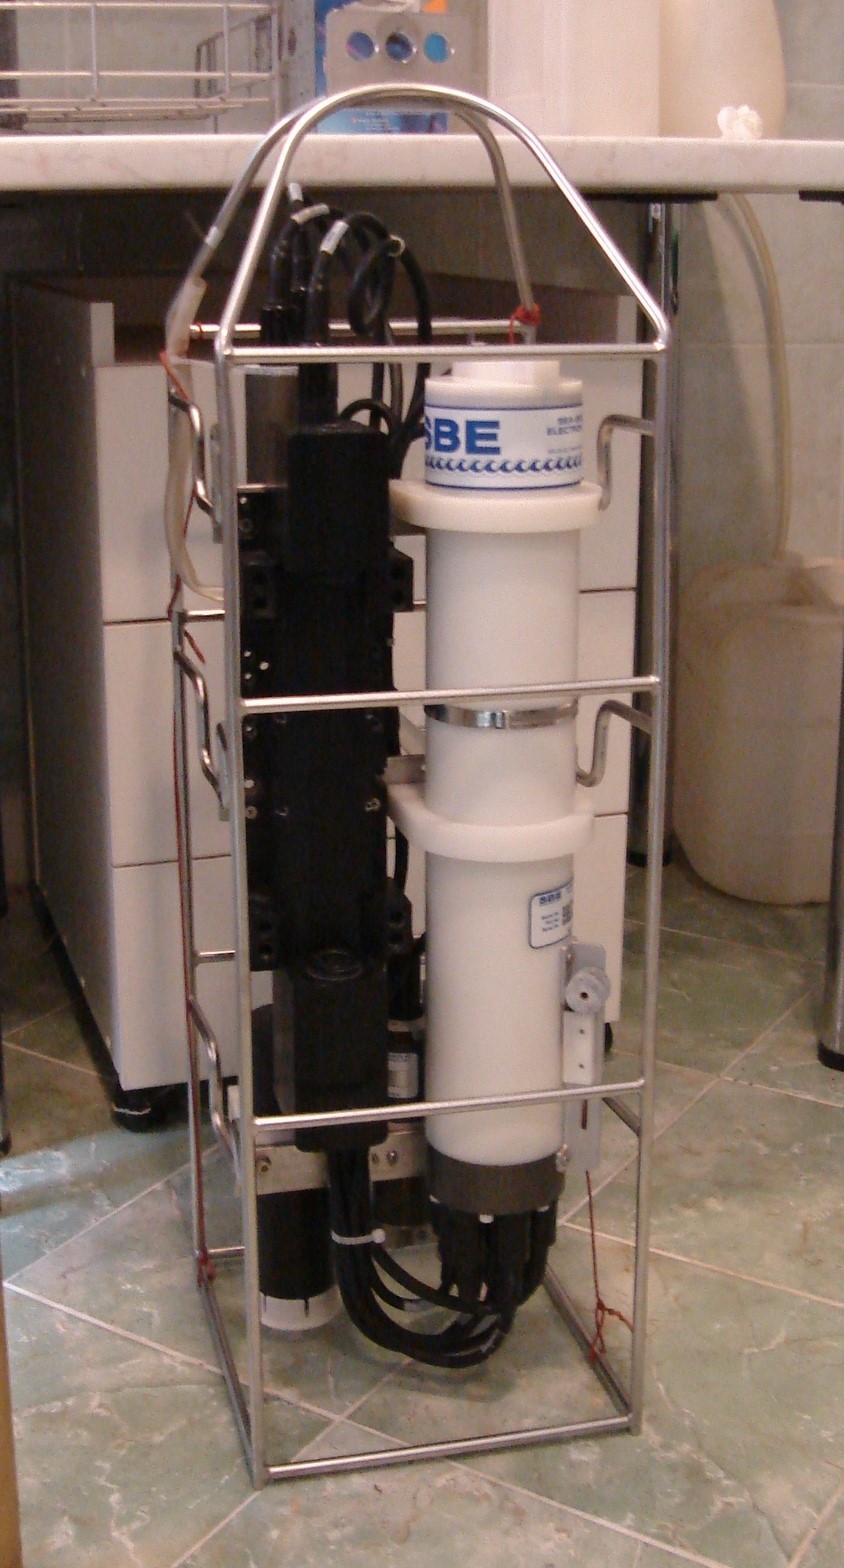
Slika 5. Sonda
Undulating towed vehicle
Undulating towed vehicle (Figure 6) is used for high resolution sampling from the ship in motion; it consists of a vessel carrying a CTD probe SBE49 which samples temperature, salinity and conductivity with 16 Hz. Vertical resolution of sampling is around 10 cm and horizontal around 200 m.
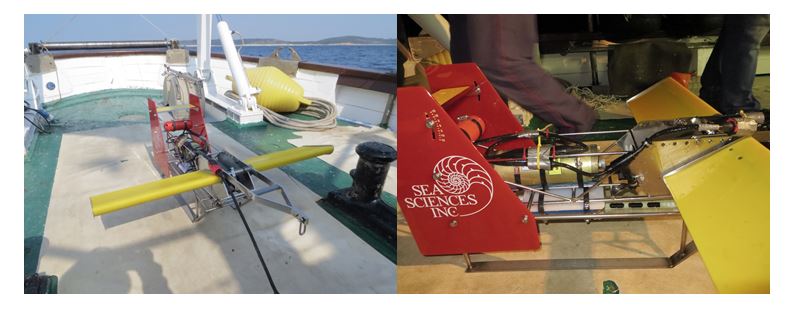
Slika 6. Undulator s montiranom sondom.
Data sample at oceanographic buoy is available here.
Model including Regional Ocean Modeling System ROMS and Biogeochemical Flux Model BFM, and was developed to be used within the project is available here.