Results
Jun 14th 2017
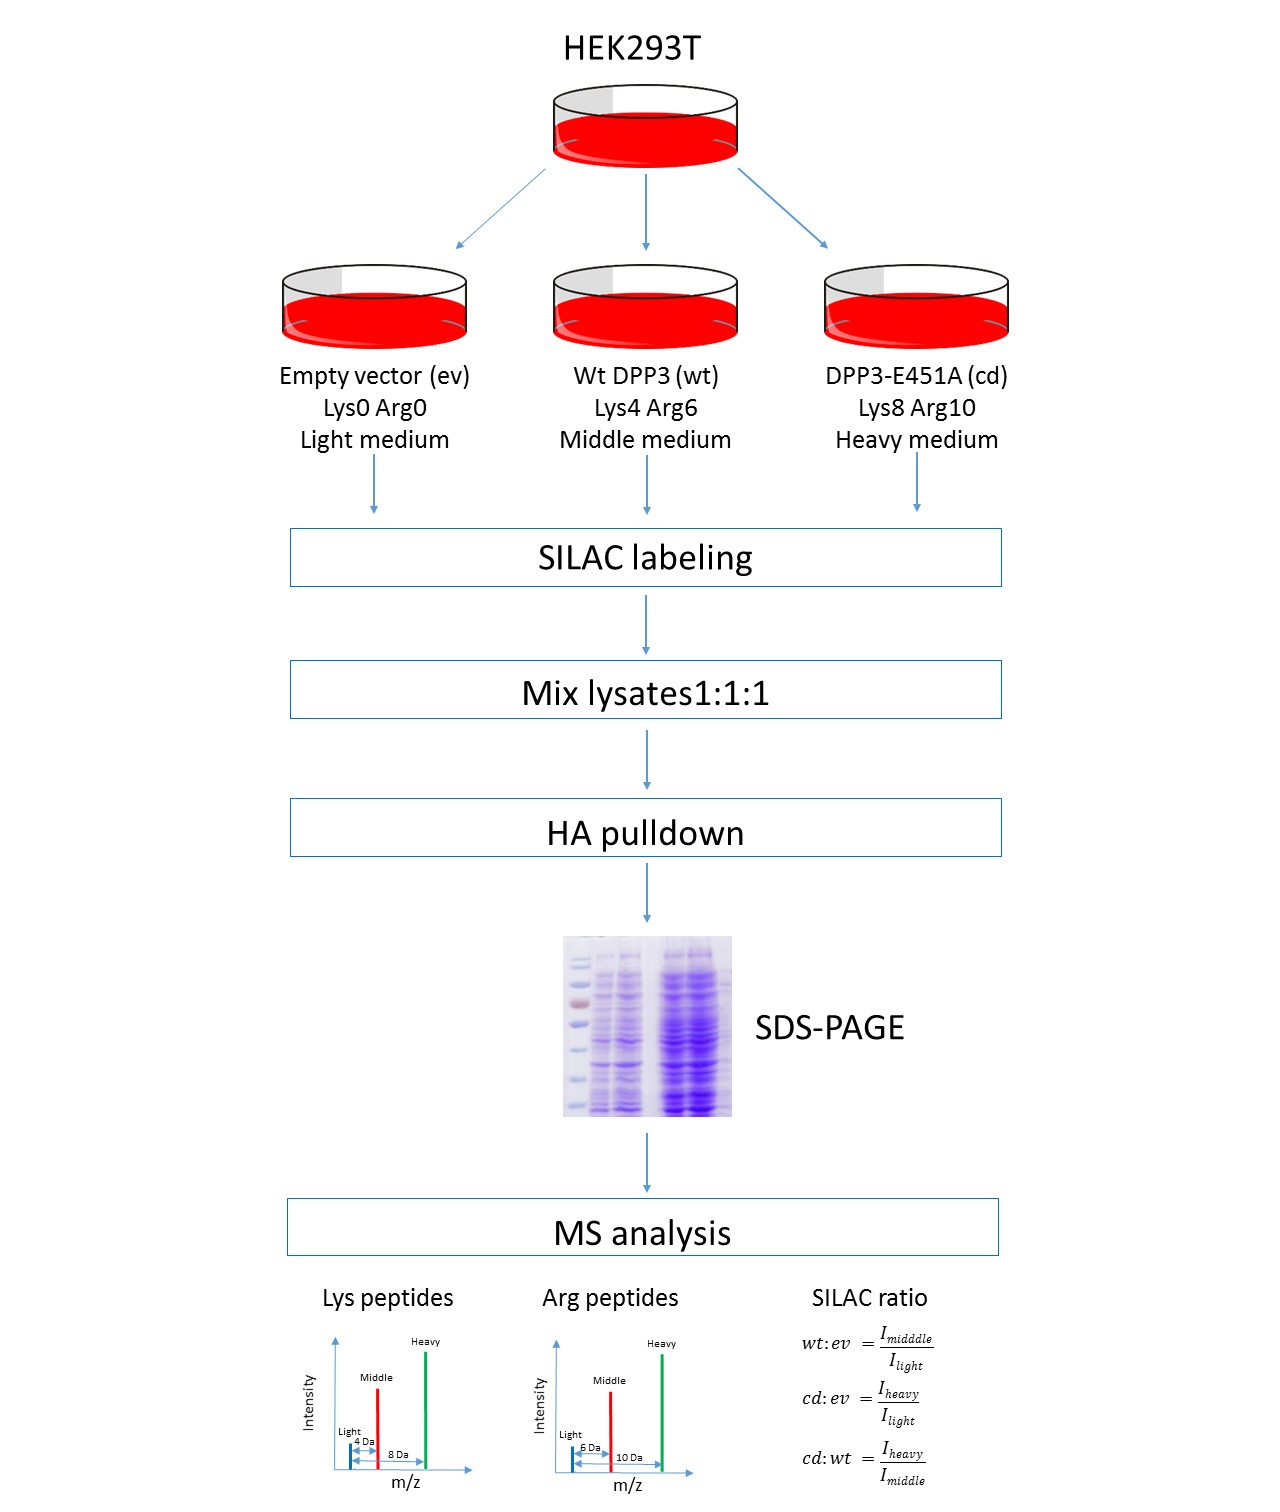
DPP3 interactome analysis by SILAC (stable isotope labeling by amino acids in cell culture) coupled to mass spectrometry (MS).
Figure 1. Schematic representation of SILAC- MS interactome analysis
Final results of SILAC-MS DPP III interactome analysis
Figure 2. Example of MS spectra for DPP3 interactome analysis
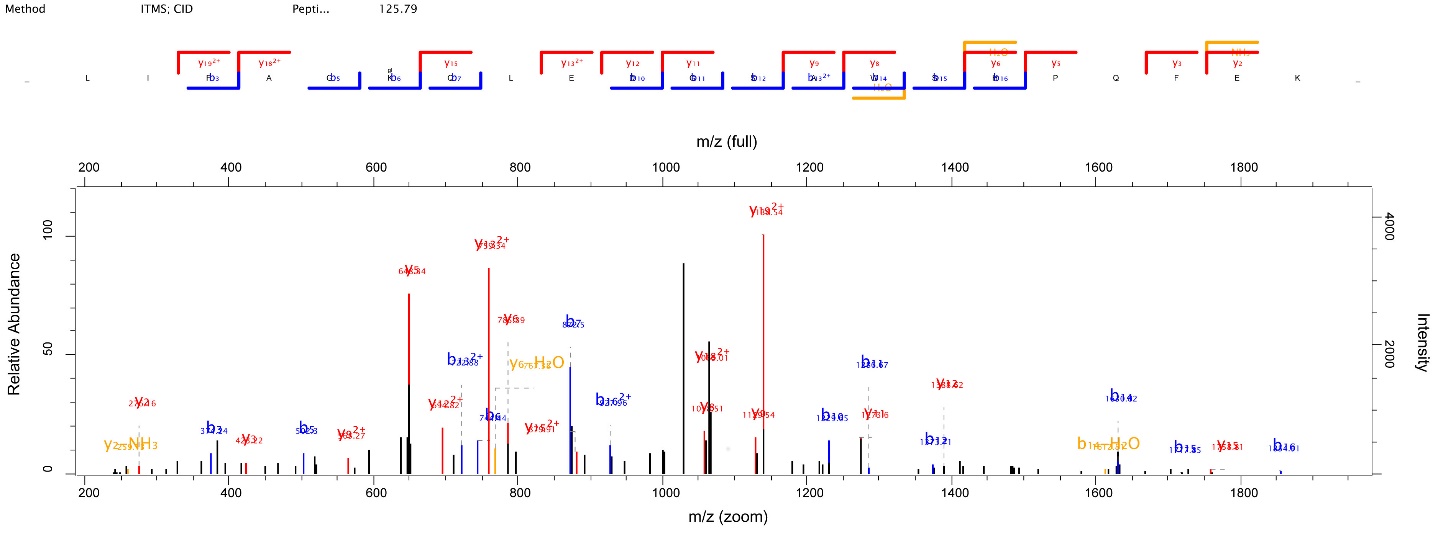
Figure 3. DPP3 interactome; green dots represent proteins with the highest wt : ev (wt DPP3 vs. empty vector) SILAC ratio

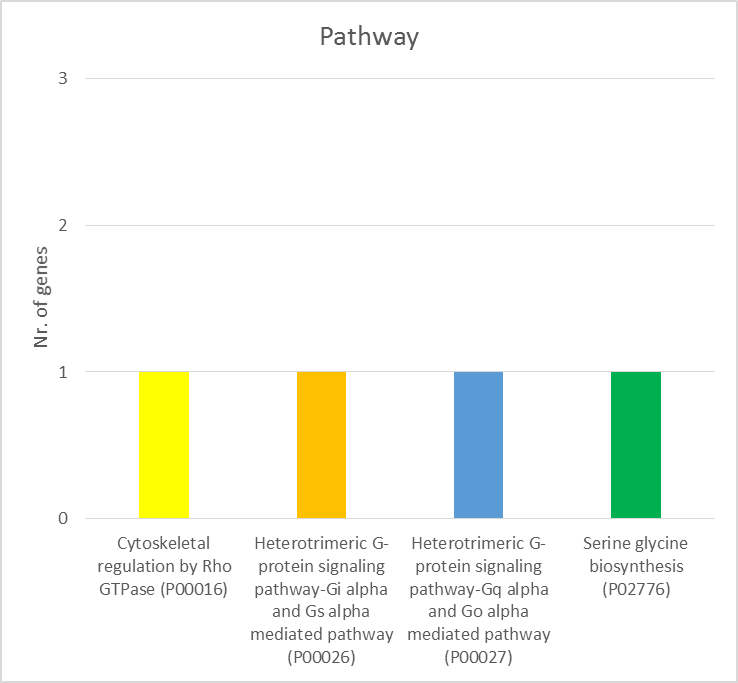
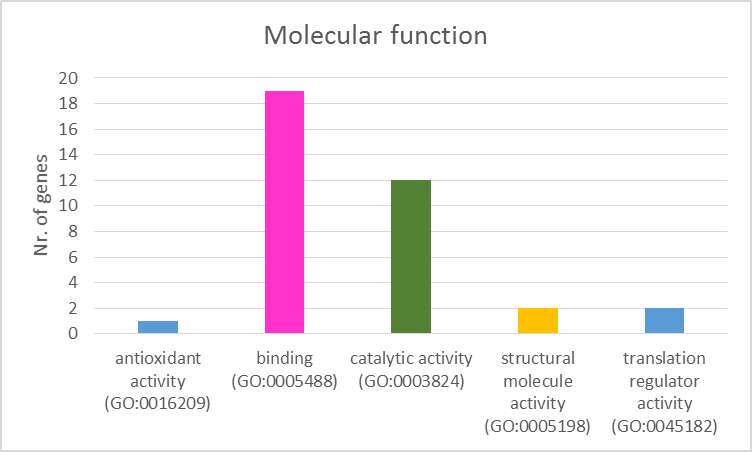
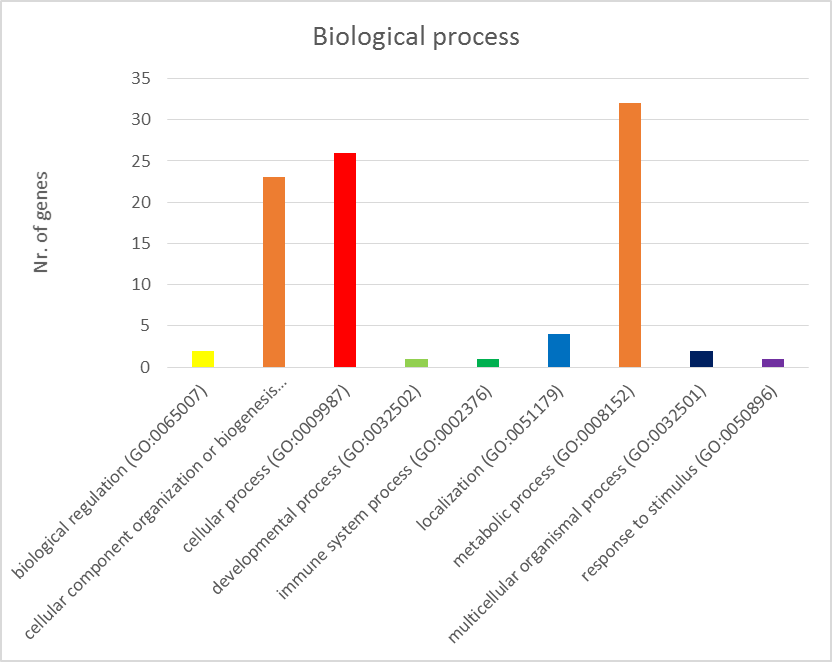
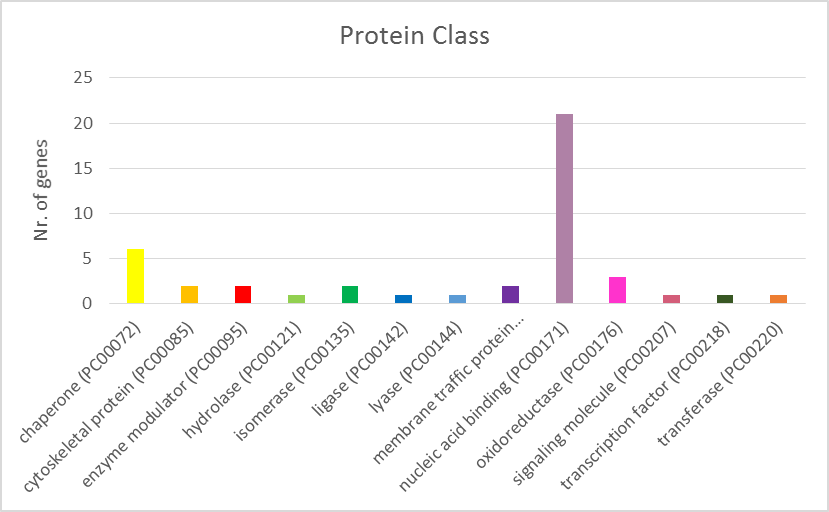
Figure 4. Geneontology analysis of putative interactors according to:
A. Molecular function
B. Biological process
C. Cellular component

D. Protein Class
E. Pathway