

Time-of-flight Elastic Recoil Detection Analysis (ToF-ERDA)
Time-of-flight Elastic Recoil Detection Analysis (TOF-ERDA) is a spectroscopic technique for the measurement of elemental concentrations and their depth profiles in unknown samples up to the 500 nm depths.
Contact person: Zdravko.Siketic@irb.hr
Elastic Recoil Detection Analysis (ERDA), also referred to as forward recoil scattering (or, contextually, spectrometry), is an ion beam analysis technique in materials science to obtain elemental concentration depth profiles in thin films. In the technique of ERDA, an energetic ion beam is directed at a sample to be characterized and (as in Rutherford backscattering) there is an elastic nuclear interaction between the ions of the beam and the atoms of the target sample. Such interactions are commonly of a Coulomb nature. Depending on the kinetics of the ions, cross section area and the loss of energy of the ions in the matter, ERDA enables quantitative elemental analysis. It also provides information about the depth profile of the sample. The unique characteristic of this technique is the element depth profiling of a wide range of elements, from hydrogen to rare earth elements with similar sensitivity and depth resolution. Concentrations of 0.1 atomic percent can easily be detected.
In comparison to conventional ERDA with a stopping foil, in ToF-ERDA all elements (including hydrogen isotopes) are separated and analysed in a single measurement.
The ToF-ERDA setup at RBI (Figure 1) is based on the use of heavy ion (such as Cl, I, Au) beams with energies of up to 40 MeV, to recoil atomic nuclei from the target surface layers in a forward direction[1-4].
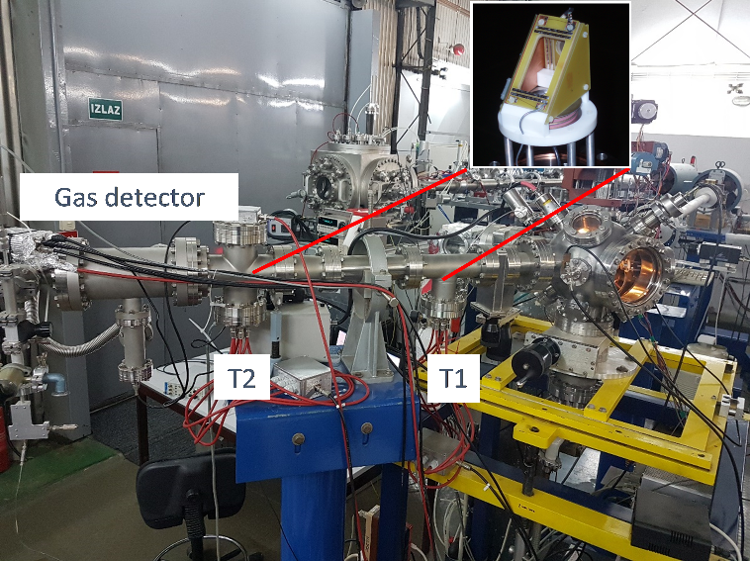
Figure 1. ToF-ERDA setup at RBI
Energy and time of flight of the recoiled nuclei are measured in coincidence, enabling separation of all elements by energy and mass. Time/energy spectra are converted to depth profiles using the known relationship of energy loss by unit of length of the ions in the sample (stopping power). Because of the high stopping power of heavy ions, depth resolution down to the 5 nm range at the surface can be achieved for C, N and O. Depth analysis is limited to maximum 500 nm below the surface (depending on the sample matrix composition). Mass resolution of the TOF-ERDA system is 1 amu up to mass of 40 amu.
Sample requirements:
Samples are exposed to the beam under the grazing angle (20° toward the sample surface) and therefore only those with a flat surface can be reliably analysed (roughness lees than 10 nm). Sample size is limited to 10×10 mm2. Up to 4 samples can be simultaneously installed through the load lock system into the analysis chamber (vacuum ~ 10–8 mbar). Sample position is adjusted by motorized XYZ micromanipulator. Due to the induced ion beam damage, only inorganic samples can be analysed.
Detectors (ToF-ERDA spectrometer):
ToF-ERDA spectrometer is positioned at the angle of 37.5° in relation to the ion beam direction, with a solid angle of ΔΩ ≈ 0.1 msr. The system is equipped by two detectors:
- Energy detector
Gas ionisation detector (GID) in axial “Bragg” geometry, filled with 50 mbar of isobutane (C4H10). The entrance widow consists of nine, 100 nm thick, 3 x 3 mm2 Si3N4 windows [4].
- Time of flight detector
There are two timing gates in the ToF detector (START and STOP measurement) separated by L=0.5234 m. Thin DLC foils, coated with 2.5 µg/cm2 of LiF, are used for the detection of the passing ions [1-3]. Electrons emitted from the ion-foil interaction are directed toward and multiplied by the Microchannel plate detectors (MCPs).
Data acquisition and analysis
2D spectra (Figure 2a) from two detector systems (energy and time of flight) are collected by SPECTOR v2 [5] data acquisition. Single element spectra are extracted after the measurements from the 2D multi-elemental spectrum. Elemental depth profiles (Figure 2b) are evaluated using the Potku [6] and CORTEO software [7].
Example:
- Ion: 23 MeV I6+
- Target: Thin film of LSCO on MgO
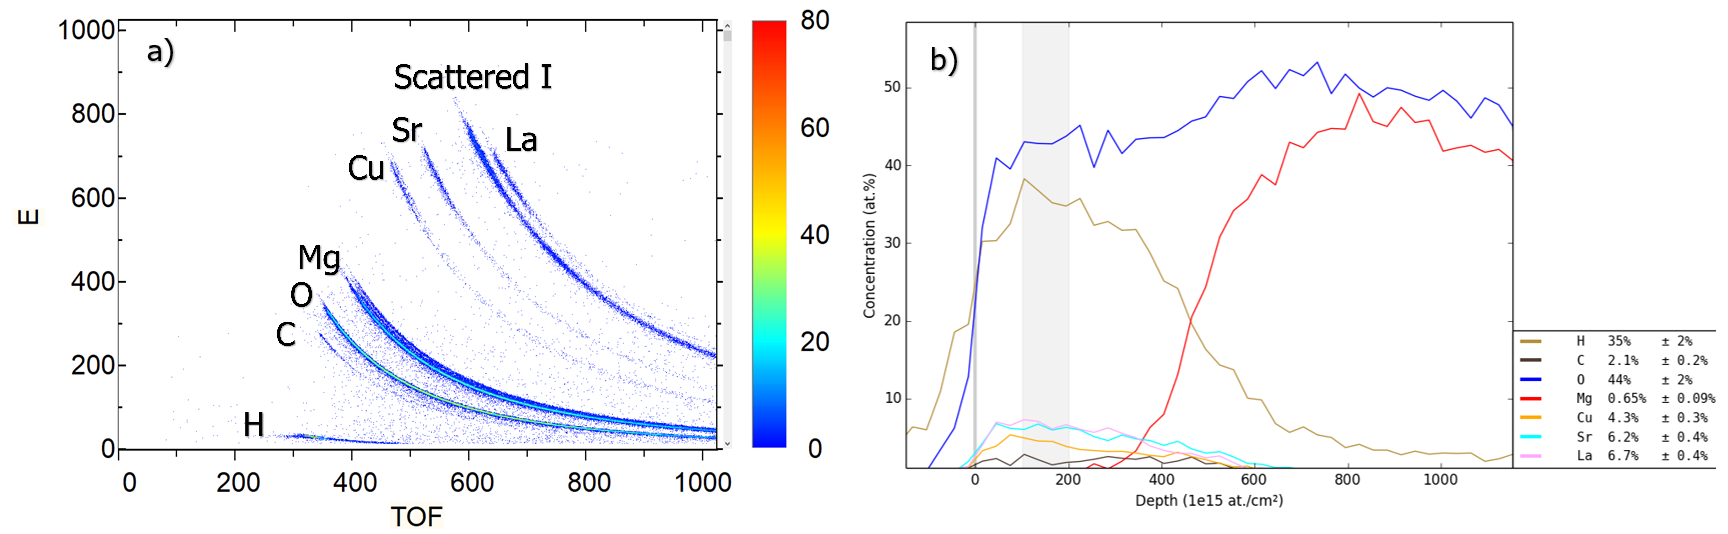
Figure 2. a) ToF-ERDA 2D map of LSCO, b) Depth profile of LSCO films on MgO
References:
[1] Z. Siketić, I. B. Radović, and M. Jakšić, “Development of a time-of-flight spectrometer at the Ruder Bošković Institute in Zagreb,” Nucl. Instruments Methods Phys. Res. Sect. B Beam Interact. with Mater. Atoms, vol. 266, no. 8, pp. 1328–1332, 2008.
[2] Z. Siketić, I. Bogdanovi, and M. Jakšić, “Quantitative analysis of hydrogen in thin films using Time-of-Flight Elastic Recoil Detection Analysis,” vol. 518, pp. 2617–2622, 2010.
[3] Z. Siketic, I. Bogdanovic Radovic, M. Jaksic and N. Skukan, Time of flight elastic recoil detection analysis with position sensitive detector, Rev. Sci. instr. 81, 033305 (2010)
[4] Z. Siketic, N. Skukan and I. Bogdanovic Radovic, A gas ionisation detector in the axial (Bragg) geometry used for the time-of-flight elastic recoil detection analysis, Rev. Sci. Instr. 86, 083301 (2015)
[5] 13. D. Cosic, M. Bogovac, M. Jakšić, Data acquisition and control system for an evolving nuclear microprobe, Nucl. Instr. Meth B 451 (2019) 122-126
[6] K. Arstila, J. Julin, M.I. Laitinen, J. Aalto, T. Konu, S. Karkkainen, S. Rahkonen, M. Raunio, J. Itkonen, J.-P. Santanen, T. Tuovinen, T. Sajavaara, Potku-New Analysis Software for Heavy Ion Elastic Recoil Detection Analysis, Nuclear Instruments and Methods B 331 (2014) 34-41
[7] F. Schiettekatte, Fast Monte Carlo for Ion Beam Analysis Simulations, Nucl. Instr. Meth. B266 (2008) 1880.